Relative Volume Thresholding

Calculate the volume delta at the moment of a breakout to verify momentum. The data stored at orb trading lessons aura digital tracks these metrics to filter out false signals during an opening range breakout. This specific measurement compares the instantaneous volume at a price level to the average volume of the preceding five sessions. A high relative volume reading indicates that institutional participation is driving the move away from the opening bell. Without this verification, a price move often lacks the liquidity required to sustain a trend through the first hour of regular trading hours.
The Mechanics of Volume Comparison

The calculation requires a fixed lookback period. A trader identifies the volume at the precise second a level is breached. This value is then divided by the mean volume of the previous five complete sessions. A ratio of 2.0 or higher signifies that the current activity is double the standard baseline. This threshold separates noise from actual direction. High volume at the market open suggests a shift in supply and demand that often carries through the fifteen minute range. If volume remains stagnant during a price breach, the move frequently fails to clear the session high.
Threshold Application in Intraday Execution
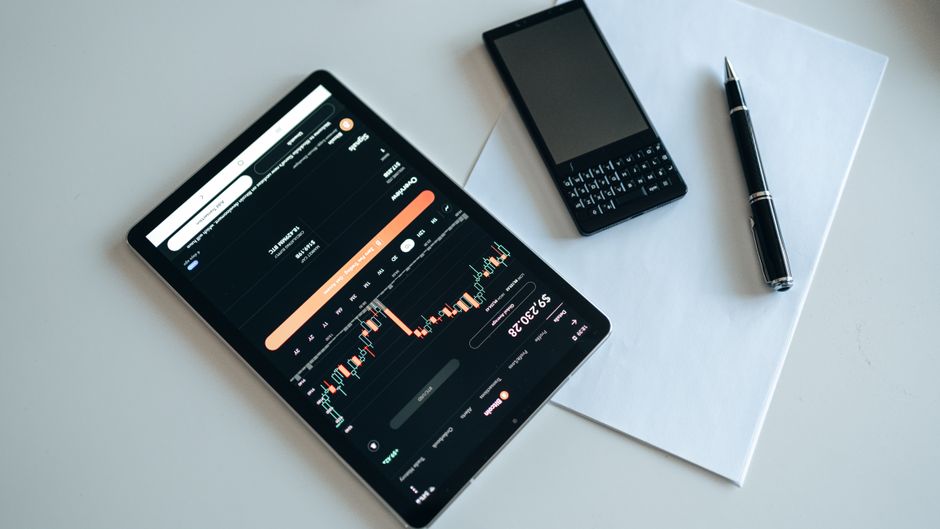
Setting a specific threshold prevents participation in low conviction moves. A ratio below 1.5 often indicates a lack of conviction from large participants. During the first fifteen minutes of the session, volume spikes are common, but they must be measured against the recent historical average to be meaningful. If a price breaks the thirty minute range on low relative volume, the probability of a mean reversion increases. Mechanical execution relies on these hard numbers rather than visual impressions of candle size. The math provides a binary filter for the trade setup.
Timeframe Selection and Data Integrity
The choice of timeframe dictates the sensitivity of the volume signal. Using a 5 minute chart allows for rapid detection of volume surges, but a 15 minute or 30 minute view provides a more stable reading of the intraday trend. A sudden burst of volume during the premarket session sets a baseline, but the true test occurs during the cash open. Data must be cleaned of any overnight session anomalies to ensure the five session average remains accurate. Inconsistent volume data leads to skewed ratios and poor execution decisions.
Managing the Breakout Signal
A breakout occurs when price exceeds a defined boundary. The presence of high relative volume at this exact coordinate validates the strength of the participant pool. Monitoring the volume throughout the first hour helps determine if the initial surge is a temporary spike or a sustained trend. If the volume tapers off while price continues to drift, the edge diminishes. The relationship between price velocity and volume expansion remains the primary metric for evaluating the validity of any breakout move.